Chart properties - Guides tab
Applications module Chart element Properties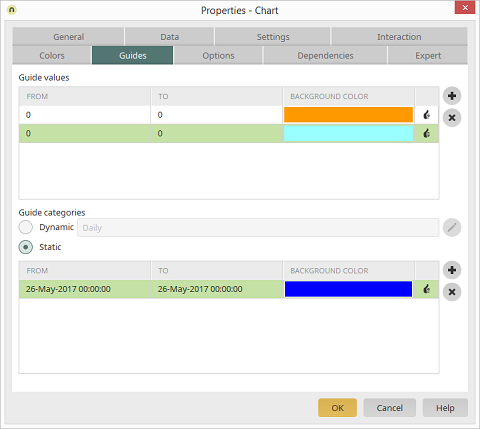
With guides, areas in the diagram can be highlighted in color. Guides can be defined for every diagram type apart from pie chart, funnel and XY charts.
Guide values
From / To / Background color column
Specify the area, which should be colored, in the first two columns. The color can be selected in the third column.Adds a new row to the list. The values can be edited directly by clicking on the corresponding cell.
Removes the selected guide from the list.
Guide categories
Dynamic
This option available if a data field with the type Date is selected for the Categories on the Data tab.Opens a dialog where the color, series pattern and duration for the guide can be defined.
Static
Here, static areas for the categories can be colored in.From / To / Background color column
Specify date values for the area, which should be colored, in the first two columns. The color can be selected in the third column.Adds a new row to the list. The values can be edited directly by clicking on the corresponding cell.
Removes the selected guide from the list.