Chart properties - Data tab
Applications module Chart element Properties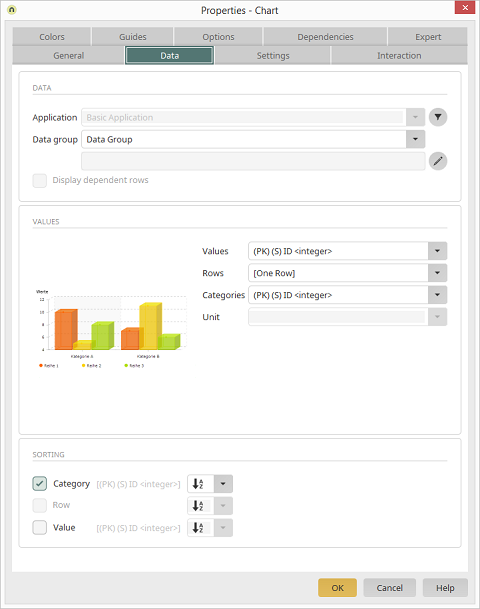
Data
Application
The current Application is already selected.Opens a dialog where a filter can be defined. This filter will filter the application data before it is presented in the chart.
Data group
Select the Data group whose values should be shown in the chart.Opens a dialog where the subordinate data groups, whose data should be included in the chart, can be selected here.
Show dependent rows
The Show dependent rows setting affects the way records that exist in a parent-child relationship to the superior, currently selected data record will be shown.Values
In the Values area, you will see the selected chart type.Values
Here, a field should be selected that contains a meaningful value. The values of this field will be automatically summated. This sum defines, depending on the type of chart, the height of the columns, length of bars, or size of the areas in the chart. Negative values can also be displayed, in that the individual rows will then be shown in the bar chart below the row axis.Rows
In this drop-down list, you will define by which criteria the values will be arranged on the x-axis (horizontal axis). By selecting [One row], which can be chosen for all chart types other than the pie chart, the Values are summated.Categories
Here, a field can be selected that should be used to group the data in the chart.Unit
For categories of the Date type, a corresponding Unit (Second, Minute, Hour, Day, Week, Month, Quarter, and Year) can be selected for display in the chart.Sorting
Data field
If required, a data field can be selected at the bottom of the dialog that determines the sorting order of the chart. You can also define whether the sorting occurs in ascending or descending order.Example
The following example shows how sales by employee in two teams can be recorded and displayed in various ways.
For the chart XY which is available in the chart type Further the description of the values can be edited.
Click on